![](https://gisdataviz.com/wp-content/uploads/2024/07/GeologicmapOfTheMoon_2024-1024x482.png)
![](https://gisdataviz.com/wp-content/uploads/2024/03/TheFiveJapans_1936-1024x645.jpg)
![](https://gisdataviz.com/wp-content/uploads/2023/10/F0WMZ0GWwAErPqR-683x1024.jpg)
![](https://gisdataviz.com/wp-content/uploads/2023/08/mapa-1024x1024.jpg)
![](https://gisdataviz.com/wp-content/uploads/2022/10/FgUYBCFXwAAasSG-777x1024.jpg)
![](https://gisdataviz.com/wp-content/uploads/2022/05/FTEAx7FUcAAuLCX.jpg)
![](https://gisdataviz.com/wp-content/uploads/2022/03/FPGZT9rXoAwN6eD-2-1024x804.jpg)
![](https://gisdataviz.com/wp-content/uploads/2022/03/FPGZT9mXsAQuD7A-1-1024x804.jpg)
![](https://gisdataviz.com/wp-content/uploads/2022/03/FOyuw9tXEAYWYJ--784x1024.jpg)
![](https://gisdataviz.com/wp-content/uploads/2022/01/FJ4QPDgWQAMGVco.jpg)
![](https://gisdataviz.com/wp-content/uploads/2022/01/FJ4mA3WXEAUmo1Z-1024x745.jpg)
![](https://crvanpollard.github.io/portfolio/images/Greenland.jpg)
![](https://gisdataviz.com/wp-content/uploads/2021/11/FD5twt8WQAAp4X9-1024x724.jpg)
![](https://gisdataviz.com/wp-content/uploads/2021/10/OceanDeepMap_SciFi_s-1024x599.jpg)
![](https://gisdataviz.com/wp-content/uploads/2021/10/@seaniesan-1024x709.jpg)
![](https://gisdataviz.com/wp-content/uploads/2021/10/FBseuy1UcAUbHwZ-691x1024.jpg)
![](https://gisdataviz.com/wp-content/uploads/2021/10/bajamapbiomasama-1024x573.jpg)
![](https://gisdataviz.com/wp-content/uploads/2021/08/1_zIwQAiQfpY6o97hkzV139w-800x582-1.jpg)
![](https://gisdataviz.com/wp-content/uploads/2021/07/E6z4yLHWEAEdWMB-772x1024.jpg)
![](https://gisdataviz.com/wp-content/uploads/2021/07/migrationchartalaskanseal_1907-1024x678.png)
![](https://gisdataviz.com/wp-content/uploads/2021/07/page-1024x665.png)
![](https://gisdataviz.com/wp-content/uploads/2021/07/E6G-igIUUAETVRl.jpg)
![](https://gisdataviz.com/wp-content/uploads/2021/07/world-1024x579.jpg)
![](https://gisdataviz.com/wp-content/uploads/2021/06/antarctica-1024x410.jpg)
![](https://gisdataviz.com/wp-content/uploads/2021/06/us-1531234391066-01-940.png)
![](https://gisdataviz.com/wp-content/uploads/2021/06/mississipiriverlidar-1024x465.jpg)
![](https://gisdataviz.com/wp-content/uploads/2021/06/E3M_vbKWYAELCk5.jpg)
![](https://gisdataviz.com/wp-content/uploads/2021/06/1623161925737-572x1024.jpg)
![](https://gisdataviz.com/wp-content/uploads/2021/06/mtoomentum-1024x481.png)
![](https://gisdataviz.com/wp-content/uploads/2021/05/E0AAnWFVUAEIQah.png)
Gráfico animado del aumento de temperatura terrestre de los últimos 140 años.
— Gobierno Abierto JCyL (@transparencia) March 14, 2022
Que maravilla de #GraphData 😍pic.twitter.com/lKHynuo8Mt
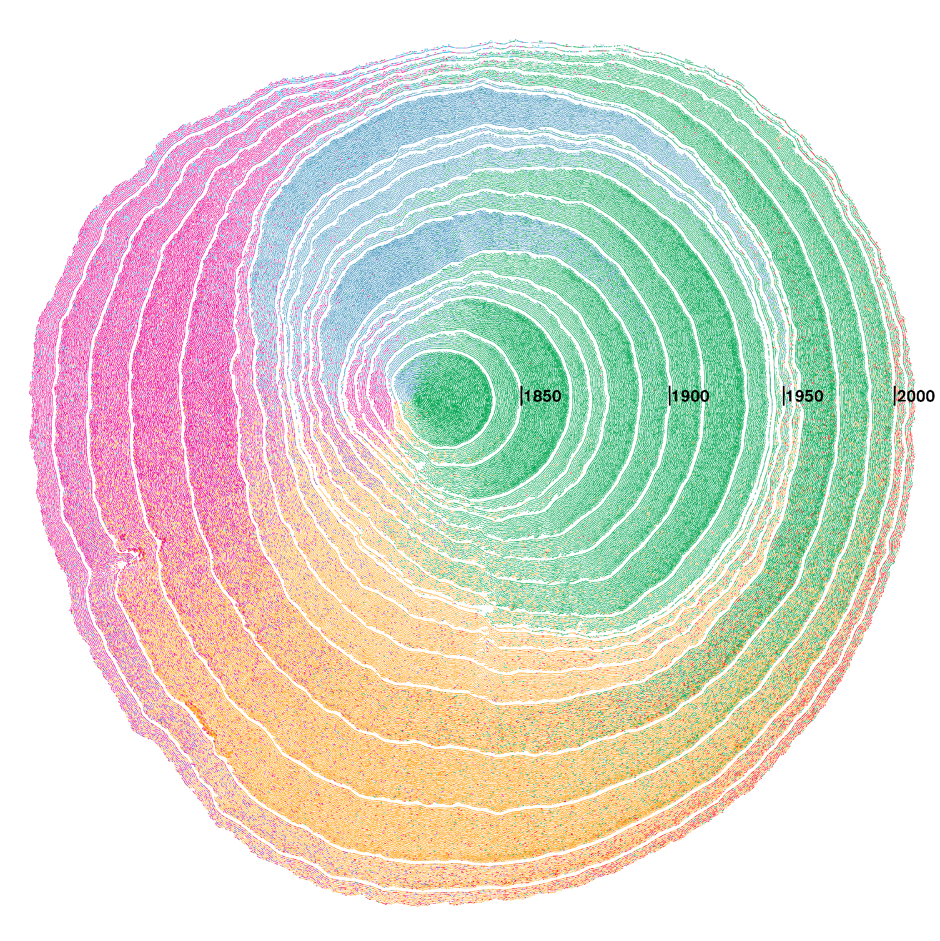
Here's ecosystem net #carbon flux average seasonal cycle on the sphere… what I really like, we see intuitively the carbon "sink" when the biosphere is sucking carbon out of the atmosphere. Thanks to @tylermorganwall @mdsumner D.Murdoch @edzerpebesma R.Hijmans #RStats pic.twitter.com/1jTl96glY6
— Markus Reichstein (@Reichstein_BGC) January 6, 2022
New #dataviz! The Earth's submarine fiber optic cable network, visualized in #RStats with #rayrender.
— Tyler Morgan-Wall (@tylermorganwall) September 22, 2021
Code:https://t.co/6tFsS4vfAK
Rayrender Github:https://t.co/iB5nWhGY7l pic.twitter.com/1FTKM0FPHr
#MayThe4thBeWithYou pic.twitter.com/HUtif2gYyr
— Craig Taylor (@CraigTaylorViz) May 4, 2021
Updated my map of the lighthouses of Ireland from the #30DayMapChallenge – now with the correct timings/flash patterns etc. Thanks to @IrishLights for providing additional information pic.twitter.com/eLlicP8fw5
— Neil Southall (@neilcfd1) December 8, 2020